The Growing Importance of Real-Time Dashboards for Business Decisions
 Johnathan Parker |
August 26, 2026 |
8:15 pm
Johnathan Parker |
August 26, 2026 |
8:15 pm
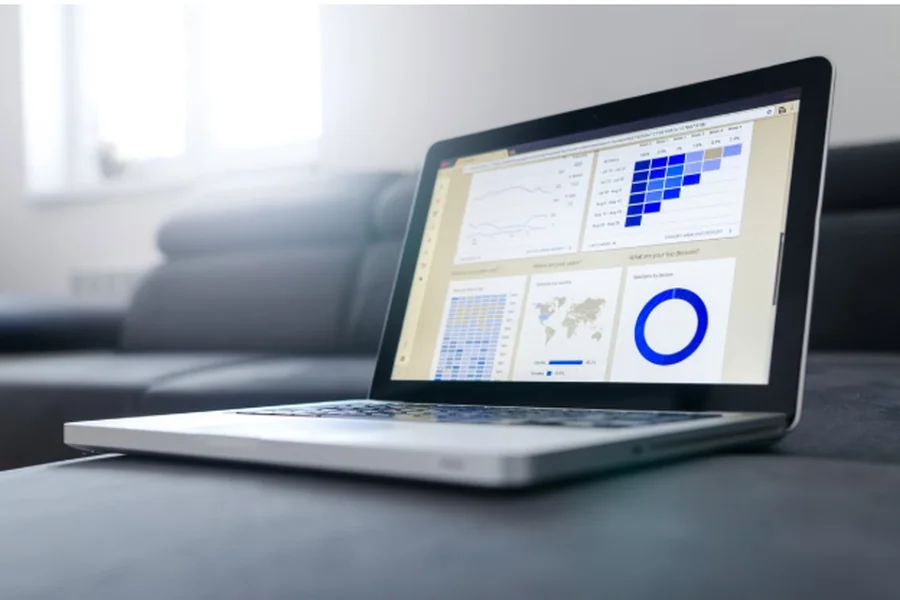
Imagine a team of senior leaders crowded around a table, squinting at printed spreadsheets that took days to pull together. By the time someone flags a sudden drop in customer engagement, that drop has already been old news for a week. The competition has adjusted, the market has reshuffled, and the window to react has slammed shut. That antiquated approach—checking in on performance once a month—just doesn’t cut it in today’s frantic environment. Organizations that cling to that pace are essentially navigating rough waters with an outdated map; they might eventually reach their destination, but not before hitting plenty of unnecessary obstacles along the way.
From Hindsight to Here-and-Now
For years, business data was treated like a history lesson—something to study after the fact and learn from retroactively. That model had its place when change happened slowly, but those days are long gone. The arrival of real-time dashboards has turned data into a living, breathing thing. It flickers and shifts with every new order, every support ticket, every website visit. Decision-makers are no longer forced to rely on stale figures; they can watch the story unfold as it happens. That immediacy changes the entire decision-making dynamic, pushing teams to act on current reality rather than guesswork based on what used to be true.
Building Without Breaking the Bank
On the development front, creating these systems used to be a monumental headache. Companies had to commission expensive custom builds, wait through agonizingly long sprints, and hope the end product matched their vision. Fortunately, the landscape looks very different now. Any organization with a decent grasp of its own operations can build a dashboard in Retool without needing to hire a battalion of developers or blow through their yearly tech budget. These user-friendly platforms hand the reins to the actual domain experts—the folks who understand the nuances of their own workflows. They can plug in data sources, rearrange layouts, and fine-tune visuals on the fly, skipping the usual bureaucratic bottlenecks entirely.
Finding the Signal in the Static
Of course, slapping a bunch of constantly updating numbers onto a screen doesn’t automatically solve anything. In fact, it can make things worse if not done thoughtfully. The dashboards that truly make a difference are the ones that separate the wheat from the chaff—highlighting the metrics that actually move the needle while quietly ignoring the rest. Nobody benefits from staring at a dizzying array of flashing charts and indecipherable graphs. The goal is clarity, not chaos. When the design is intuitive and the data is curated, these tools act like a compass rather than a fire hose, pointing teams toward what needs their immediate focus.
Shifting the Office Dynamic
Beyond the technical wins, there’s something fascinating happening to workplace culture when live dashboards become the norm. They have a knack for dissolving the invisible barriers that keep departments isolated from one another. When the marketing crew and the logistics team can both see the same real-time numbers, they start to speak a common language. Excuses become harder to make, and accountability becomes a shared responsibility rather than something to dodge. There’s a refreshing transparency that emerges when everyone is looking at the same moving picture—it fosters collaboration in a way that static reports never quite managed to achieve.
The Pitfalls Nobody Talks About
But let’s not pretend this is all smooth sailing. There are some legitimate downsides that catch organizations off guard. For one, alert fatigue is a genuine problem; when every minor fluctuation triggers a notification, people start tuning out the very warnings they should be heeding. Then there’s the temptation to treat short-term blips as earth-shattering trends, leading to frantic overcorrections that do more harm than good. The most successful teams approach their dashboards with a healthy dose of skepticism—they use the data to prompt curiosity, not to dictate knee-jerk reactions. Numbers are guides, not dictators.
Tailoring the Tempo
Another thing worth keeping in mind is that speed isn’t universally beneficial. A freight company tracking time-sensitive shipments genuinely needs updates by the second. A branding agency checking social sentiment, on the other hand, can comfortably wait an hour or two between refreshes. The flexibility of modern dashboard solutions means organizations can calibrate that urgency department by department, ensuring that the folks who need breakneck speed get it while everyone else enjoys a quieter, more focused experience. This nuanced approach prevents the whole company from being dragged into a constant state of high alert.
The Final Takeaway
Looking ahead, the trajectory is unmistakable. Businesses that embrace data as a dynamic, flowing resource—rather than a static archive—will continue to pull ahead of the pack. The tools to get started are more accessible than ever, and the excuses for lagging behind are wearing thin. Still, it’s worth remembering that live data alone isn’t some magical cure-all. Instant visibility loses its value if there’s no courage or wisdom behind the decisions it informs. The real magic happens when raw information meets thoughtful interpretation—when the numbers on the screen spark meaningful conversations and deliberate action, not just frantic reaction. That’s where the true competitive edge lies.